Real estate is one of the most manually operated industries in Pakistan. Most of it still runs on processes that have not changed in twenty years. Excel sheets with no version control. Master plans printed and reprinted every time a stakeholder changes their mind. Inventory tracked in a notebook on the sales manager's desk.
That is what the industry looks like in 2026, and it is the reason every project launch costs more than it should.
Forty-seven prints. One quarter. We counted.
Last year we watched one developer launch a new project. The master plan went to print before the launch event. The Monday sales meeting brought revisions. Print again. The Wednesday stakeholder review brought more. Print again. The phase boundary moved on Friday. Print again. A buyer presentation on Saturday needed a clean copy with only that buyer's plots highlighted. Print again.
We counted. Forty-seven prints of the same master plan in one quarter. Different versions in different hands. Marker-pen circles drawn over marker-pen circles. Reconciliation between the map and the inventory Excel was a weekly event that took half a day and was wrong by Friday anyway.
We started building Vector after that.
What Vector is
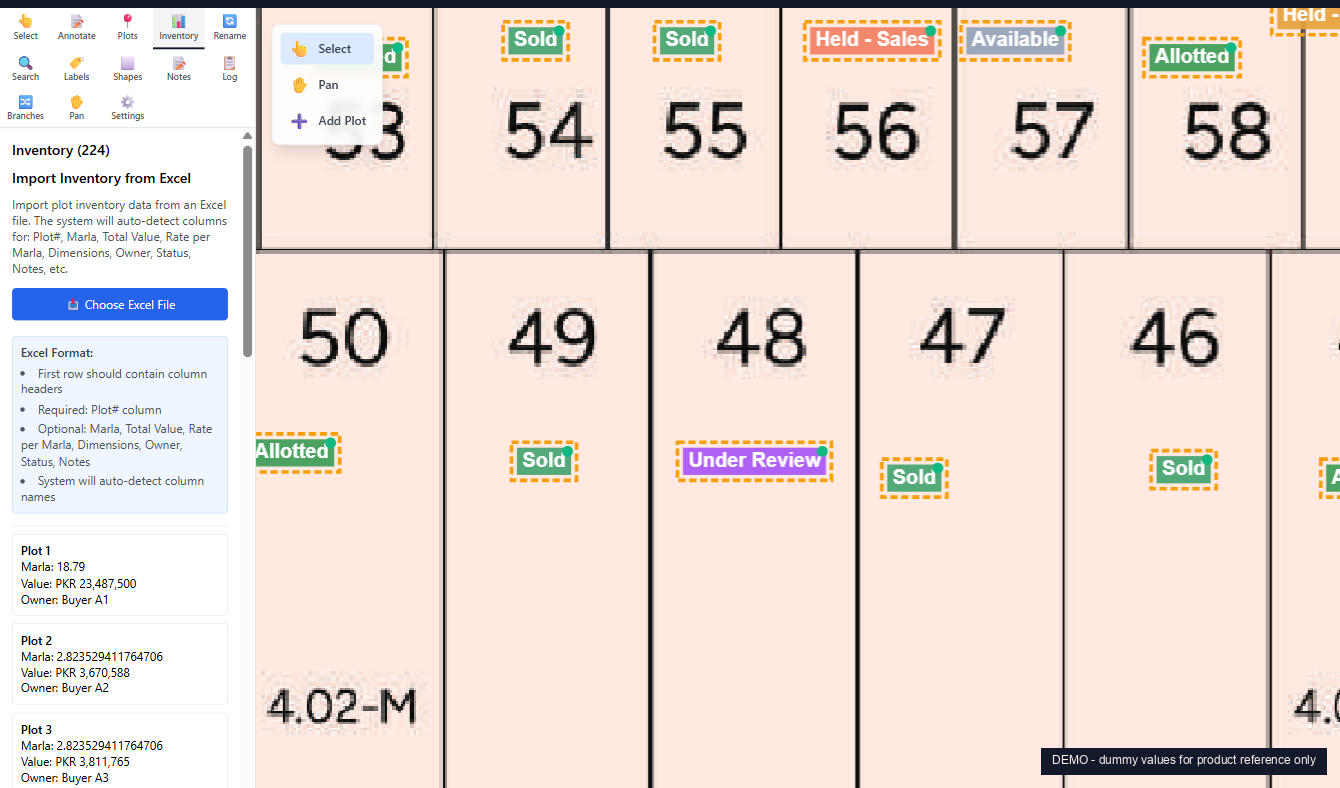
Vector is a customized map tool for real estate developers, investors, and brokers. Three steps to start:
- Upload your existing master plan PDF. Vector reads it as the base layer. Your original file stays untouched.
- Upload your existing Excel inventory. Vector auto-detects the column headers (plot number, marla, rate, total value, dimensions, owner, status, notes) and links every row to the matching plot on the map.
- Define your buckets. This is the step nobody else offers.
Buckets: paint the map the way your business runs
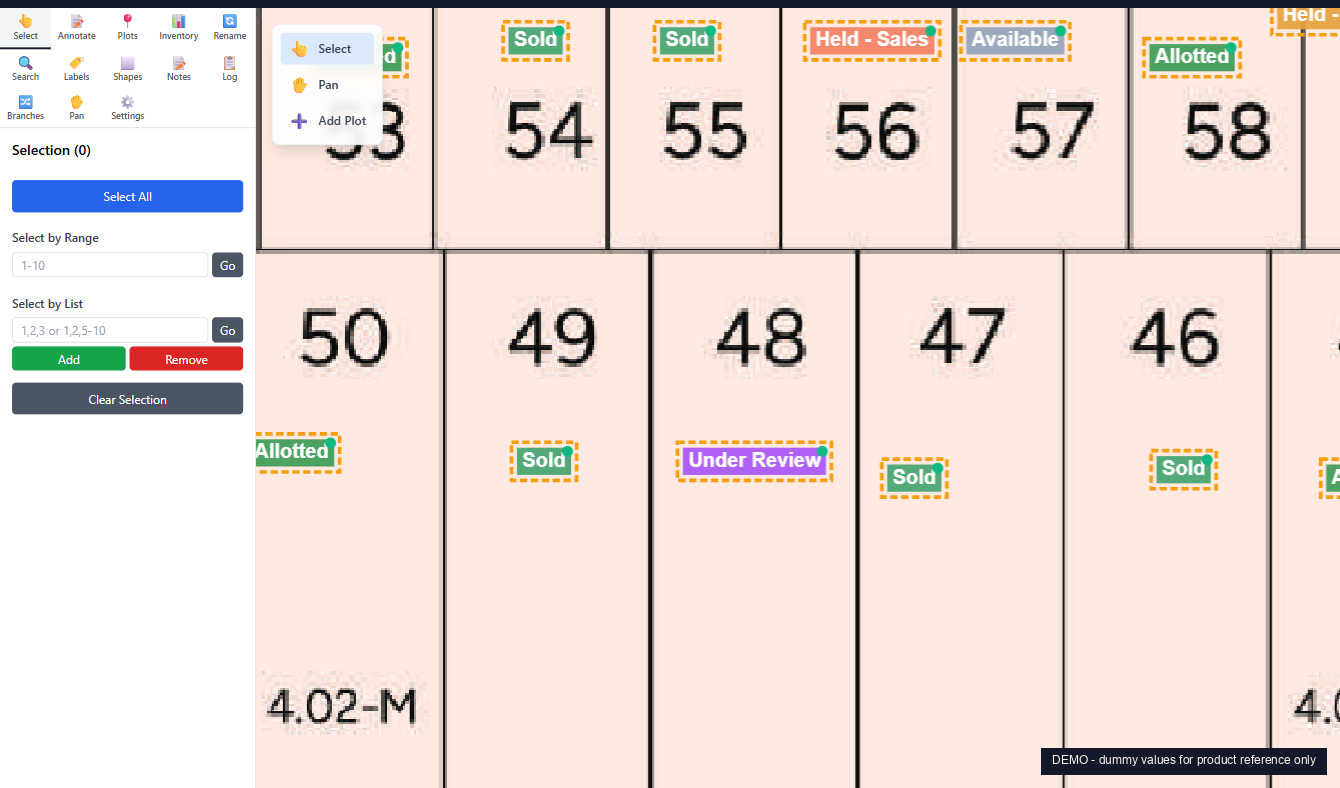
Off-the-shelf software gives you a fixed list of statuses. Sold. Allotted. Available. That works for some teams. It does not work for the way most real estate businesses in Pakistan actually run.
Vector lets you define the buckets yourself. Some of the ways teams use them:
- By investor. One project, fifty investors, fifty buckets. Each investor gets their own colour on the same map. Open the project and see which investor holds which block, where their concentrations are, and what is still unallotted. Reconciliation drops from a week to live.
- By buyer. Every customer gets their own bucket. Useful when one buyer owns plots scattered across the project, or when you want to hand a customer a personal proposal showing exactly what is theirs.
- By status. Sold, Allotted, Held, Reserved, Under Review, Available. The classic view for daily sales operations.
- By phase, price band, or broker. For leadership reviewing rollout pace, brokers screening for buyer budgets, or commission tracking.
The same map repaints into any of these views without rebuilding anything. Switch from a toggle. The legend updates. The colours update. The counts update.
What it looks like in practice
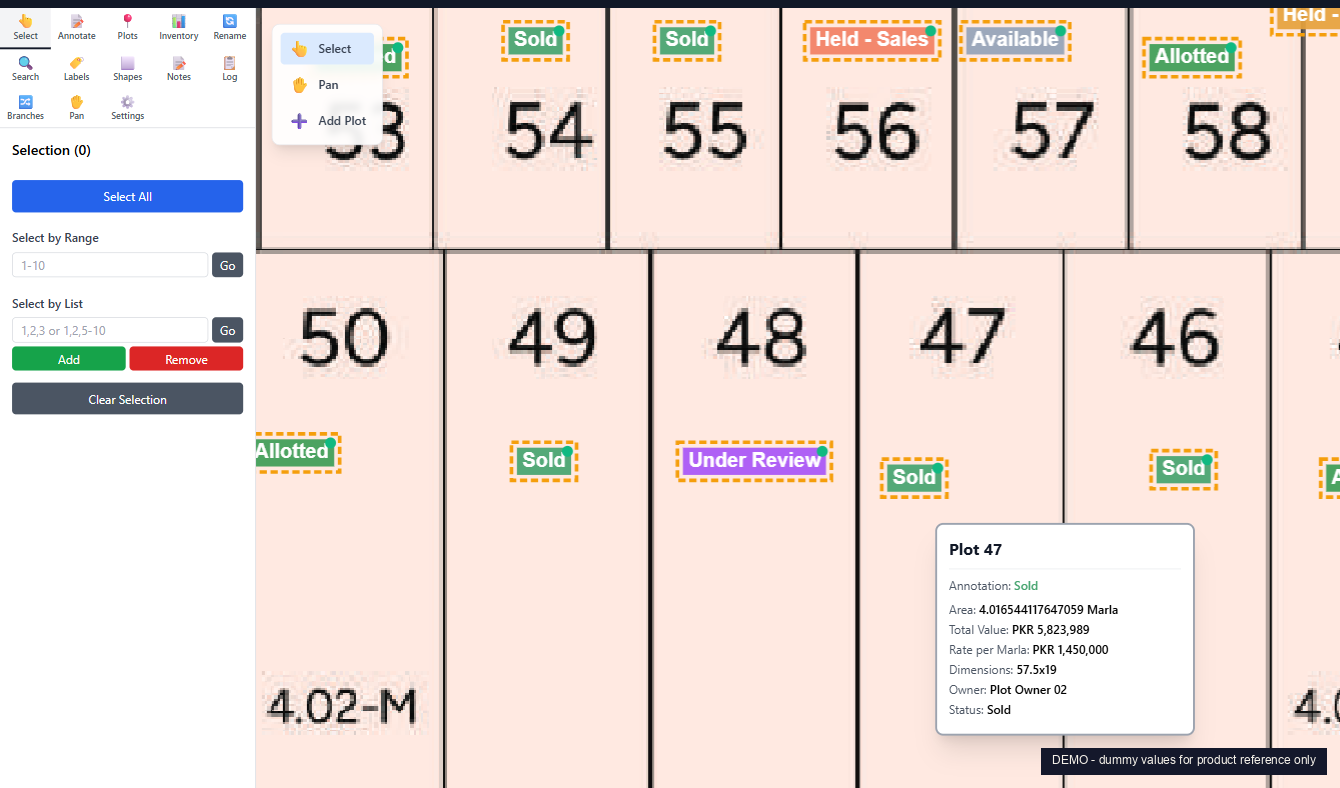
Hover any plot. A floating card shows everything: marla, rate per marla, total value, dimensions, owner, status, notes. No clicks. No modals.
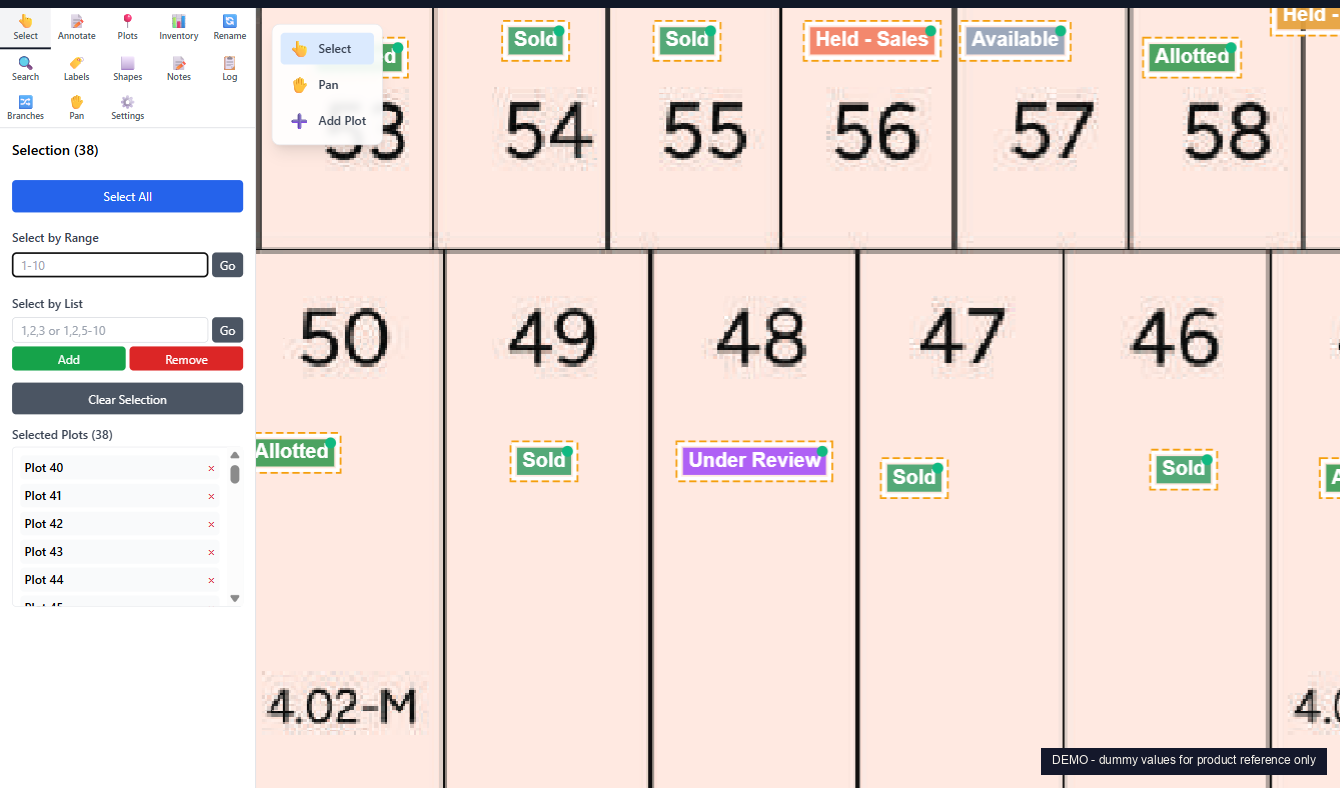
A range input (40 to 77) selects 38 plots at once. The sidebar shows the running total: selection count, total marla, total value. Build a proposal block, mark a phase for hold, or export the selection to Excel.
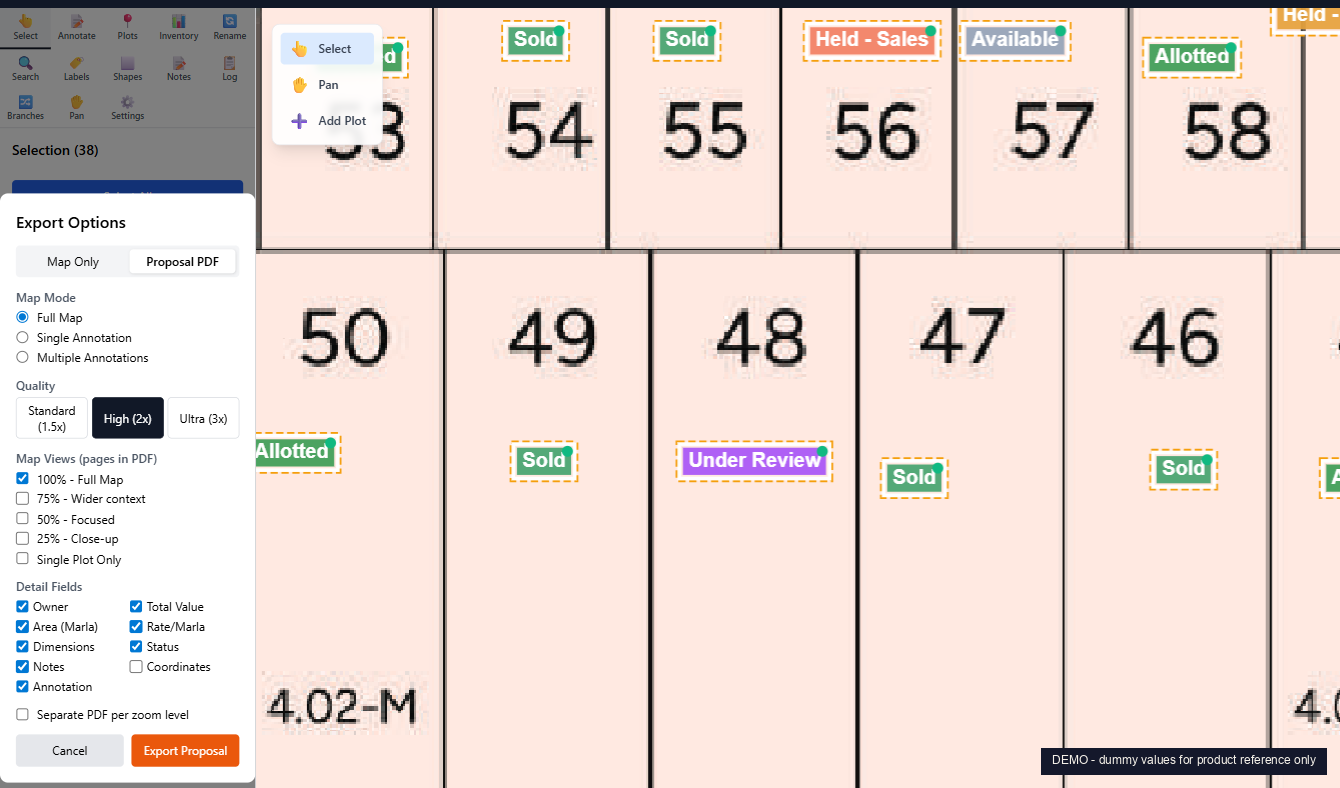
The proposal PDF exporter is the reason most teams come to Vector. Pick the plots a buyer cares about. Choose which fields to show. Pick the zoom levels: full map, focused block, single plot, close-up. One click. A branded PDF lands in your downloads, ready to send on WhatsApp. It replaces the print, mark, scan, email loop.
Your Excel inventory, linked to the map
Your inventory is already in Excel. Good. Upload the file and Vector auto-detects the columns, matches each row to its plot, and links them. No naming convention to learn. Re-import any time. When the map and the Excel disagree, Vector flags every mismatch: map plots with no inventory row, inventory rows with no plot. Reconciliation drops from a weekly half-day to live.
Why not AutoCAD or ArcGIS
These tools are excellent at what they were built for. They were not built for real estate inventory and buyer proposals.
AutoCAD is a drafting tool. Around USD 2,300 per user per year, and using it well takes months of training. Asking a sales manager to edit an AutoCAD file is not a workable process.
ESRI ArcGIS is a geospatial platform. Around USD 13,000 per user per year. Built for surveyors, urban planners, and GIS analysts. Setting up custom rules for "show me the plots assigned to Investor 23" takes real GIS expertise.
Vector skips both. The whole tool is built around how developers and brokers actually work: plots, buckets, allotments, proposals. No drafting skills. No GIS course. The learning curve is hours, not months.
Audit log and branches
Every change is logged. Who, when, what. Filter by user or by action. When a buyer asks "but I thought Plot 47 was mine?", the answer is in the change log.
Branches are the other feature worth knowing. The Master branch is your live map. Alongside it you can keep an Investor Block branch, a Phase 2 Proposal branch, or a Corner Premium branch. Each one is a parallel view of the same data. Useful when you want to model a re-allotment without touching the live map.
The stack
Python backend on FastAPI, with SQLAlchemy and PostgreSQL. ReportLab for PDF export, openpyxl for Excel import. React 18 frontend on Vite, with a custom canvas renderer for the map, JWT auth, and role-based access control. Docker-deployed, monitored, backed up nightly.
How to start
Vector is delivered as a custom per-project deployment. Your master plan PDF. Your inventory Excel. Your team accounts. Your branding. Your buckets. No per-user licence fee. Pricing is per project, scoped to size and complexity, and a typical deployment goes live in two to three weeks.
If your team prints the master plan more than once a quarter, the math is simple. Vector pays back in print savings and reconciliation time alone, before you count the faster proposal turnaround.
If you are a real estate developer still working on your maps manually, see the Vector product page or reach out below. We would be glad to show you a live map built on your own plan.