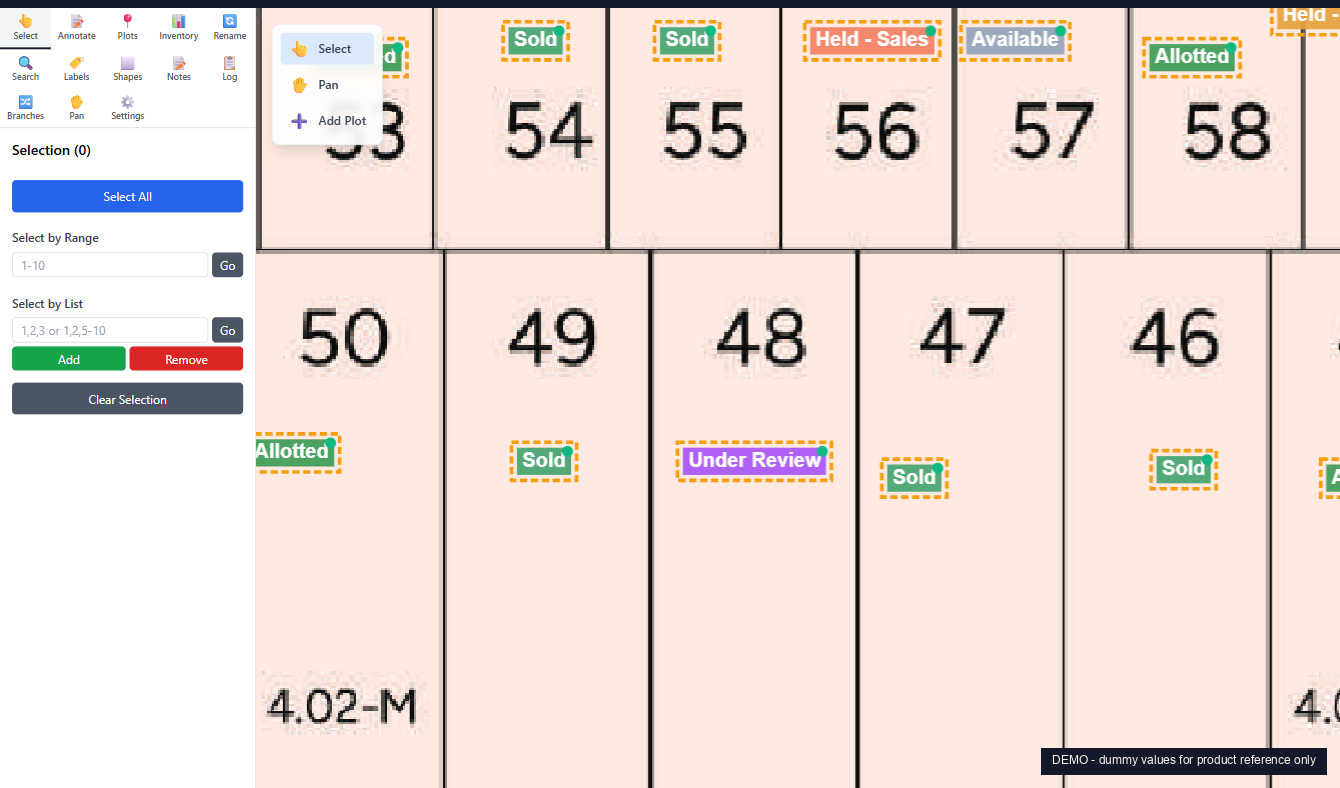
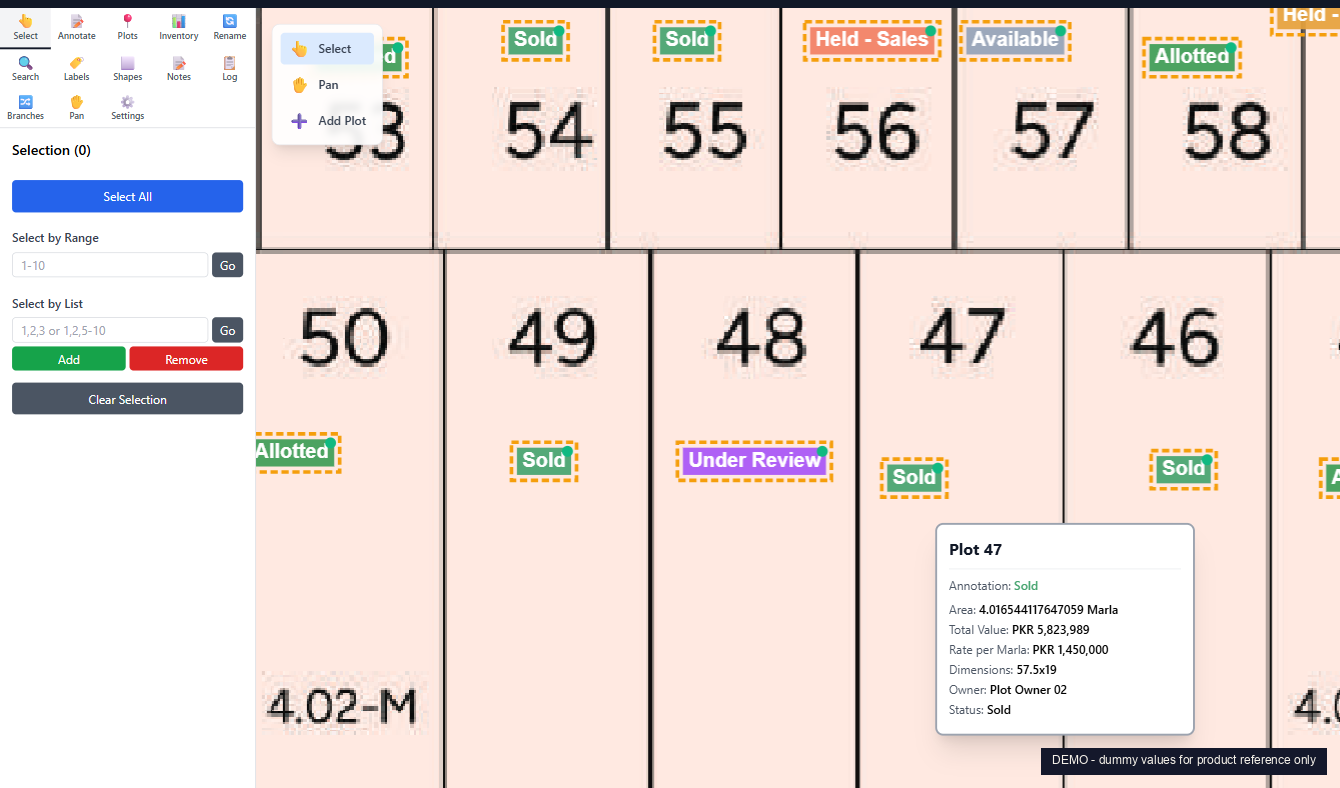
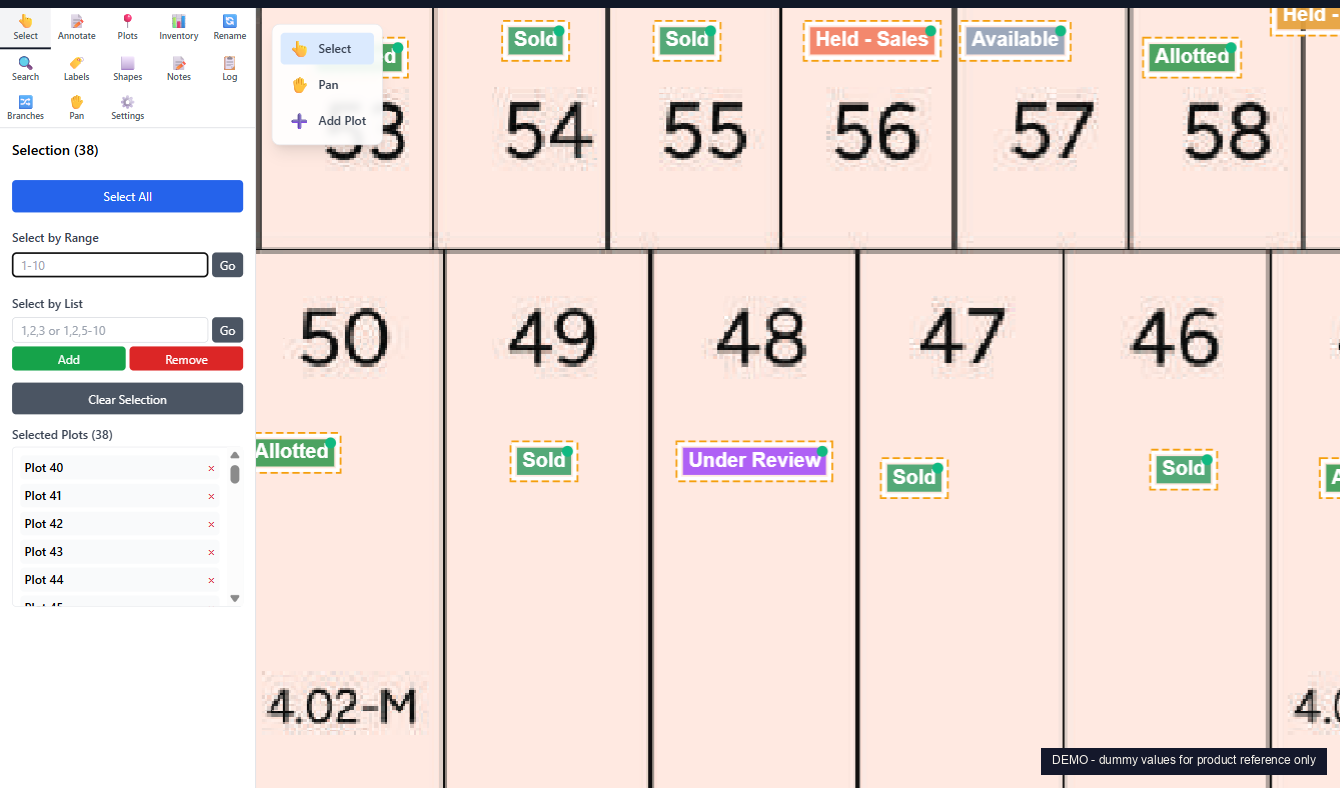
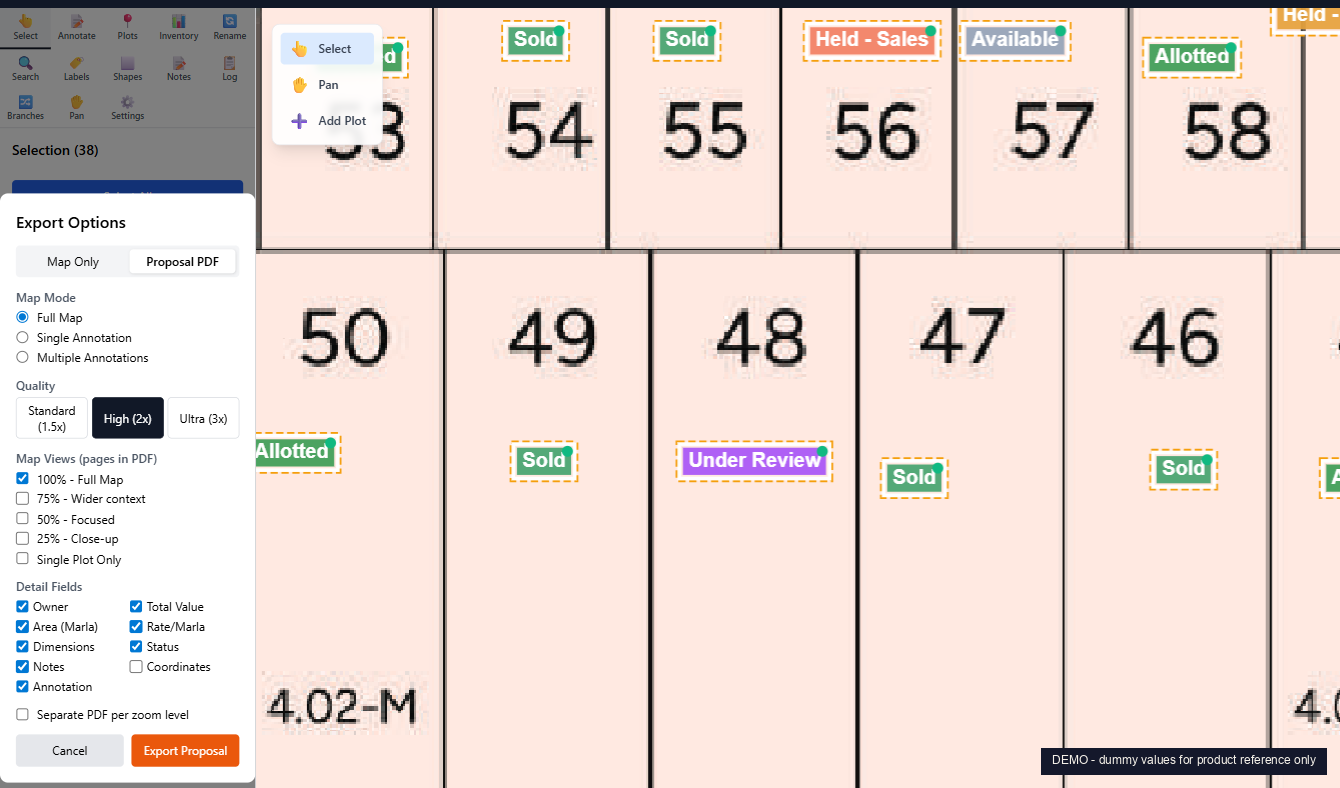
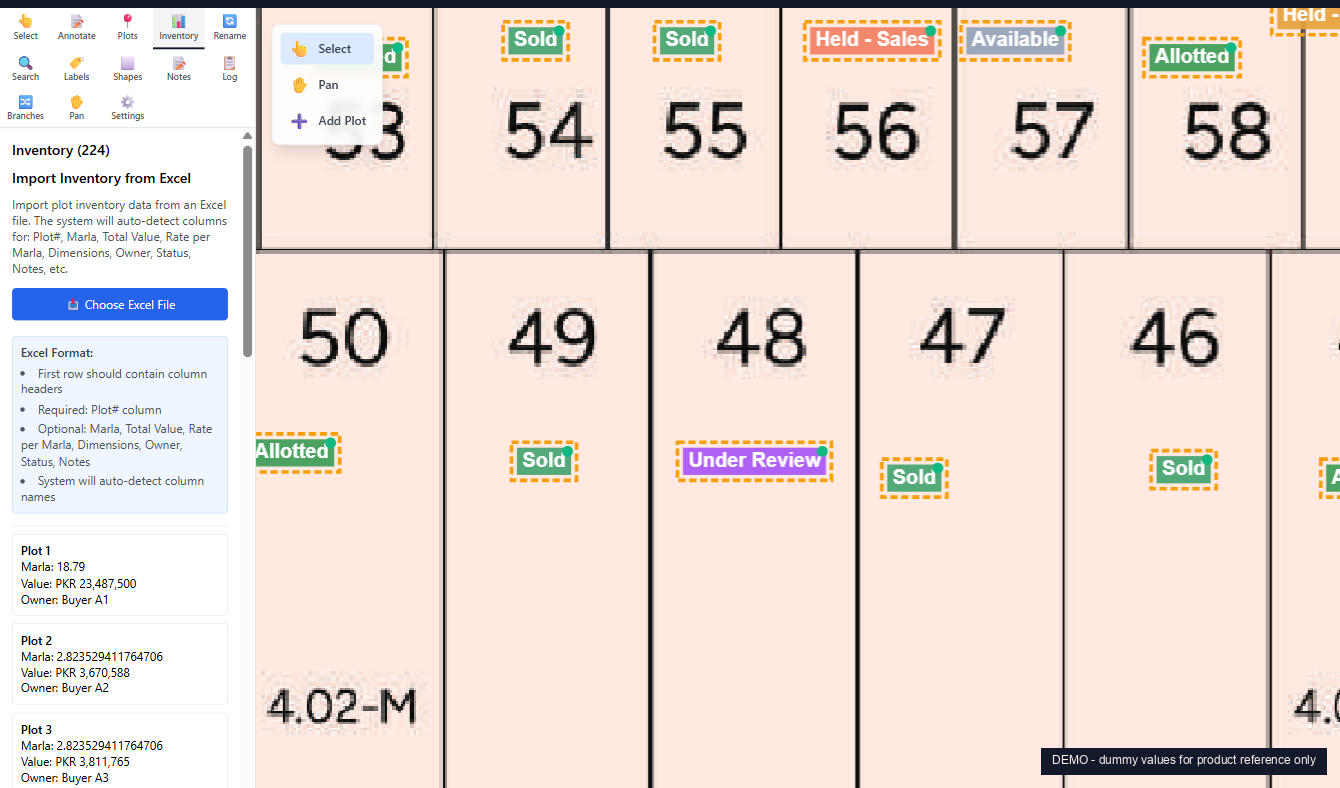
We tracked one project launch where the same master plan was printed and revised forty-seven times in a quarter. We built Vector after that. A customized map tool for real estate developers, investors, and brokers. Visualize digitally. Revise a thousand times. Print only when there is a real reason to.
Python backend, React frontend, PostgreSQL, Docker-deployed. ยท Built for chaos. Built for scale. Production grade.
If any of these sound familiar, Vector replaces the loop you're stuck in.
Stakeholder meeting Monday. Allotment changes Tuesday. Phase boundary moves Wednesday. Today that means a new print run, marker pens, scan, email. We tracked one launch that hit forty-seven prints of the same plan in a quarter. With Vector, the master plan stays digital. Edit. Save. Send a link. The print bill drops to almost zero.
A family wants a 10-marla corner plot, park-facing, in your price band. Today you flip through binders, mark up a paper map, take a photo on WhatsApp. With Vector, filter the map to matching plots, hide the rest, export a clean proposal PDF with the buyer's name on it.
Your master plan PDF lives in one place. Your inventory Excel lives in another. Allotments change in one, not the other. Reconciliation eats a week. Vector imports the Excel, links each row to its plot on the map, and flags mismatches. One source of truth.
Open the map. See at a glance which investor holds which block, which buyer owns which plot, where the corner premiums sit, what is still unallotted. No reports to wait for. No "let me check with the sales team". The shape of the project is visible the moment you load the page.
Vector does not lock you into a fixed list. Categorize the way your business actually runs:
The map paints to whichever buckets you create. The legend pins to the corner and updates live as your team works. Switch between bucket views without rebuilding anything.
Marla, dimensions, rate per marla, total value, owner, status, notes. All of it in a floating card the moment your cursor lands on the plot. No clicks, no modals, no "let me pull up the spreadsheet".
Pick plots by range (40-77), by list (1, 5, 12-18, 42), or by clicking. The sidebar shows the running total: how many selected, total marla, total value. Build a proposal block, mark a phase for hold, or export the selection to Excel.
The reason developers and brokers come to Vector. Pick the plots the buyer is interested in. Choose what fields to include. Pick the zoom levels (full map, focused block, close-up, single plot). Generate. The PDF lands in your downloads ready to send on WhatsApp or email.
Upload your existing Excel inventory. Vector auto-detects the columns (plot number, marla, rate, dimensions, owner, status, notes), matches each row to the plot on the map, and links them. From then on, every change in the inventory shows up on the map, and every hover shows the inventory record.
Every panel is built for the way real estate teams work. Click through any one in a live demo and see the full data flow.
Range, list, click. Track total marla and total value of the selection live.
Fully custom buckets with colours. By investor, by buyer, by status, by phase. Drag plots between buckets.
Master list of every plot. Search, sort, jump-to on the map.
Excel import, auto-detect columns, re-import deltas, reconcile mismatches.
Mass rename plot numbers when blocks get re-numbered after a planning change.
Find a plot by number, owner, status, value range, marla range, or notes.
Add text labels for road names, blocks, amenities, phase markers.
Draw rectangles, ellipses, polylines over the map for amenities or proposed expansions.
Free-text notes attached to plots or to the whole project. Versioned.
Every change is logged: who, when, what. Filter by user or action.
Master plan plus parallel branches: Investor Block, Phase 2 Proposal, Corner Premium.
Smooth pan and zoom. Keyboard shortcuts. Fit-to-screen one tap.
Tile rendering, plot styling, annotation defaults, deeper configuration.
AutoCAD and ESRI ArcGIS are world-class, but they're built for drafting and geospatial analysis. Vector is built for the specific way developers and brokers in Pakistan and the GCC actually work.
| AutoCAD | ESRI ArcGIS | Vector by Sitara | |
|---|---|---|---|
| Built for | Drafting and design | Geospatial analysis | Real estate inventory and proposals |
| License cost | USD 2,300 / user / year | USD 13,000 / user / year | Per-project, no per-user fees |
| Learning curve | Months of drafting training | Steep GIS expertise required | Hours. Built around your existing workflow |
| Excel inventory link | Manual export and re-import | Custom scripting | Native. Auto-column-detect on first import |
| Buyer proposal PDF | Manual export, no buyer fields | Custom layout work | One-click. Choose plots, zoom, fields, done |
| Custom plot buckets | Manual layer setup | Symbology rules to build | Define your own. Investor, buyer, status, phase, anything |
| Audit log | None | Add-on | Built in. Every change, every user |
Real estate developers, brokers, and project operations teams who work with master plans, plot inventory, and buyer proposals. If your team prints the master plan, marks it up by hand, then reprints when allotments change, Vector replaces that loop.
No. Upload your existing PDF master plan. Vector reads it as the base layer, then overlays plots, annotations, shapes, and labels on top. Your original PDF stays untouched. When the architect issues an update, swap the PDF and your annotations move with it.
Upload your Excel inventory sheet. Vector auto-detects column headers (plot number, marla, rate per marla, total value, dimensions, owner, status, notes) and links each row to the matching plot on the map. From then on, every plot shows its inventory record on hover or full detail view.
A buyer-specific filtered export. Pick the plots the buyer cares about, choose which fields to include (owner, marla, value, dimensions, status, notes), pick zoom levels (full map, focused block, single plot, close-up), and Vector generates a branded PDF ready to send on WhatsApp or email. Replaces the print, mark, scan, email cycle.
AutoCAD is a drafting tool. ESRI ArcGIS is a geospatial platform that costs around USD 13,000 per user per year. Vector is purpose-built for real estate inventory and buyer-facing workflows. No drafting skills required. The whole tool is built around the way developers and brokers actually work: plots, status, allotments, proposals.
Yes. Vector is delivered as a custom deployment per project: your master plan, your inventory, your branding, your team accounts. Pricing is per project, not per user. Contact us via WhatsApp or the form below for a scoped quote.