Loom Monitoring & Weaving-Floor Efficiency

LoomIQ. The floor already knows. Now you do too.

Your weaver knows which loom struggled all night. The office finds out at shift end, on paper, twelve hours late. LoomIQ closes that gap. It reads the data your looms already produce and turns it into one live picture of the whole floor: every loom on one screen, refreshed within the minute, every stop classified. This is the standalone efficiency and productivity layer for a weaving mill.


Two minutes, your floor's language

A short silent tour of LoomIQ: the live floor, one loom's full story, the floor drawn in 3D, the morning scorecard, and the reports. No audio needed.

LoomIQ product tour · 2 minutes · a demonstration weaving floor

The whole shed on one screen

Walking the shed reads one loom at a time. Decisions need all of them at once. LoomIQ gives you both the wide view and the single loom, on any phone.
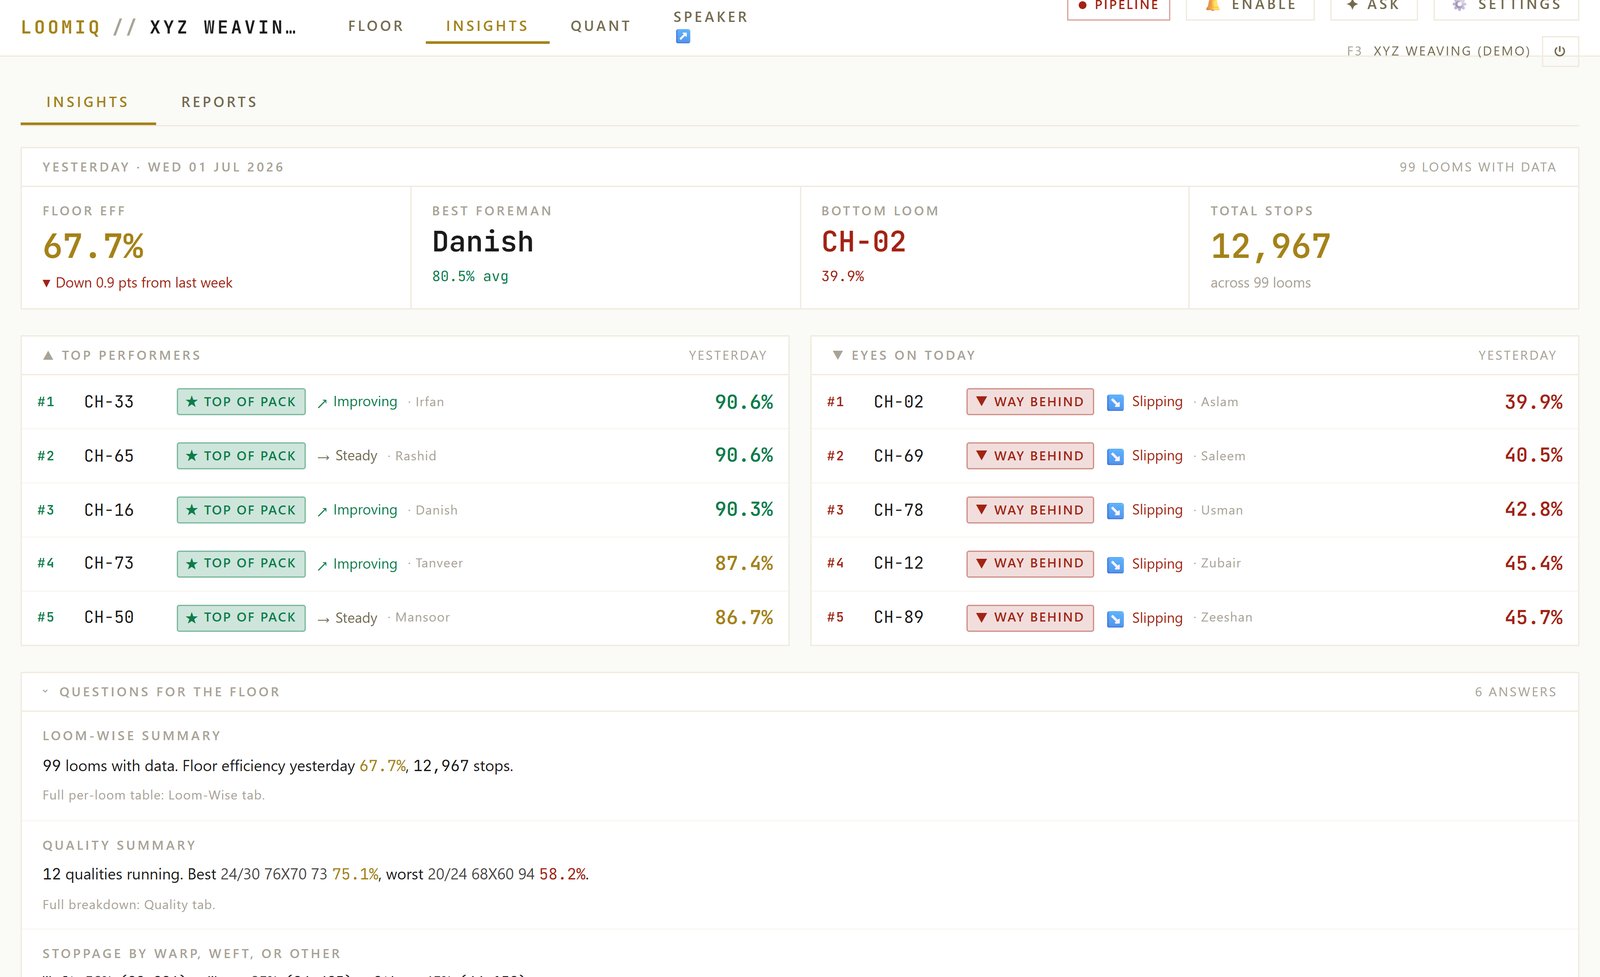
Live floor view

Every loom is a tile with its live status and efficiency, the construction on the beam, and the weaver on record. Sort by efficiency or stops, filter by shed. The moment a loom stops, you see it, not at shift end.

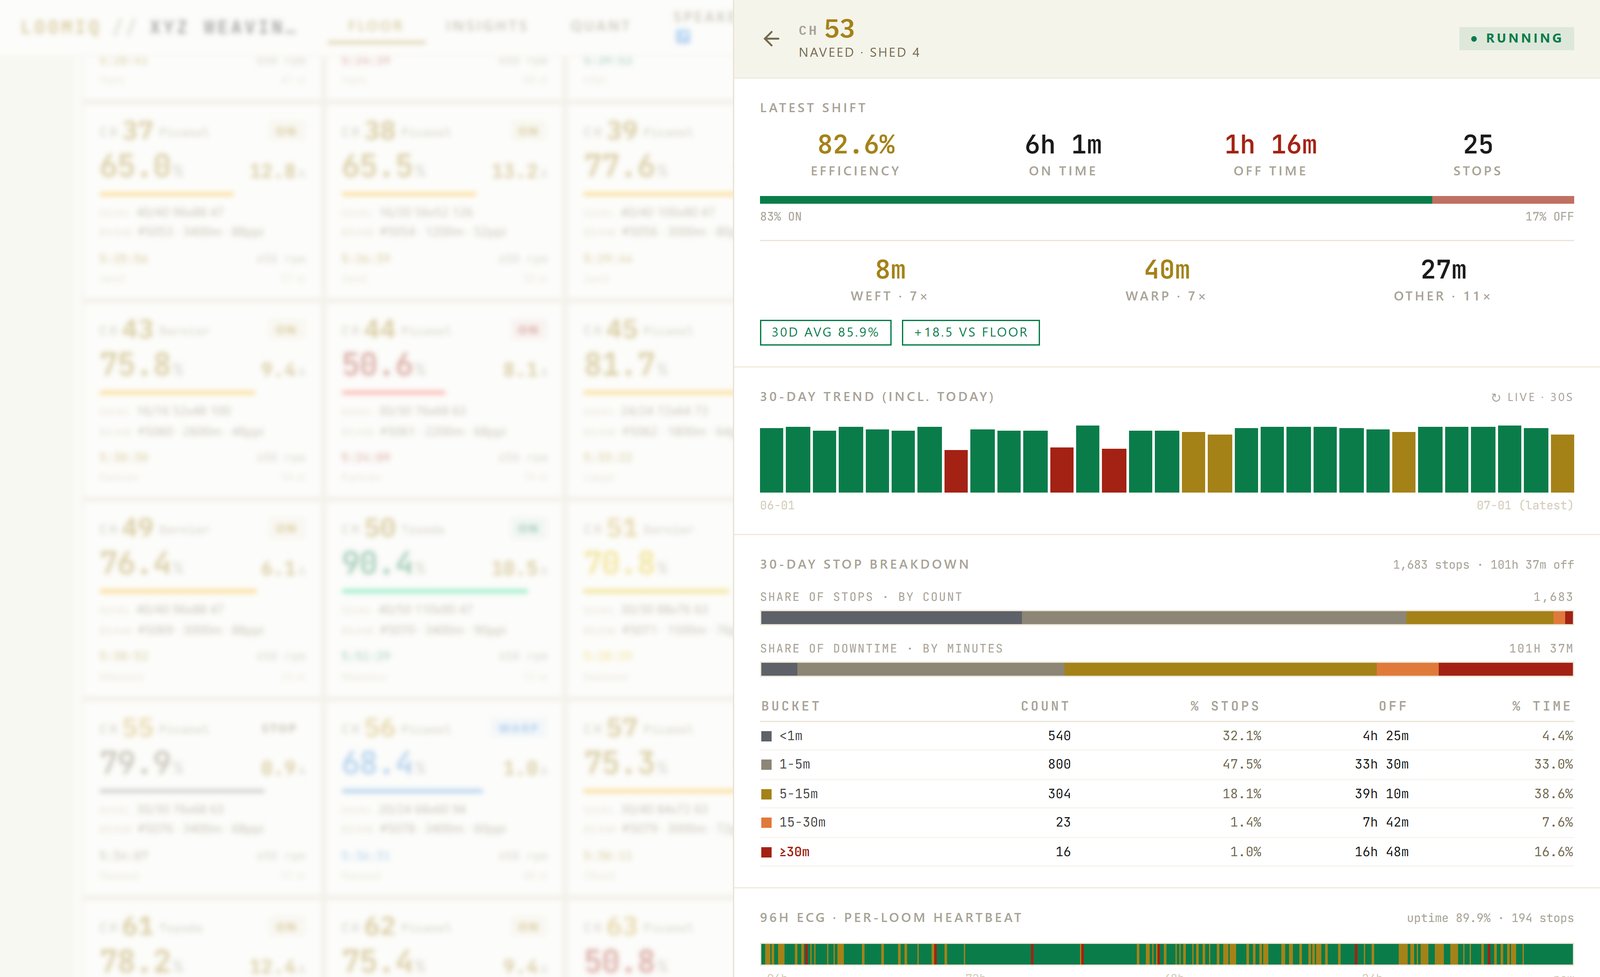
One loom's whole story

One click opens a single loom's full history: its efficiency trend, every stop profiled by reason and duration, and its heartbeat over the last several days. The argument about which loom, which shift, whose set, ends here.

Your floor in 3D

A site model draws all 99 looms in their real positions across the sheds, colour-coded by status. You read the floor the way you walk it, then click straight through to any loom.

Fresh within the minute

LoomIQ sits on top of the LDM hardware you already have, whether INZ, CLD, or generic. It reads the data read-only, never writes to the sensors, and refreshes the picture in under a minute.

LoomIQ live floor view: 99 looms on one screen with live status, efficiency, construction and weaver per loom

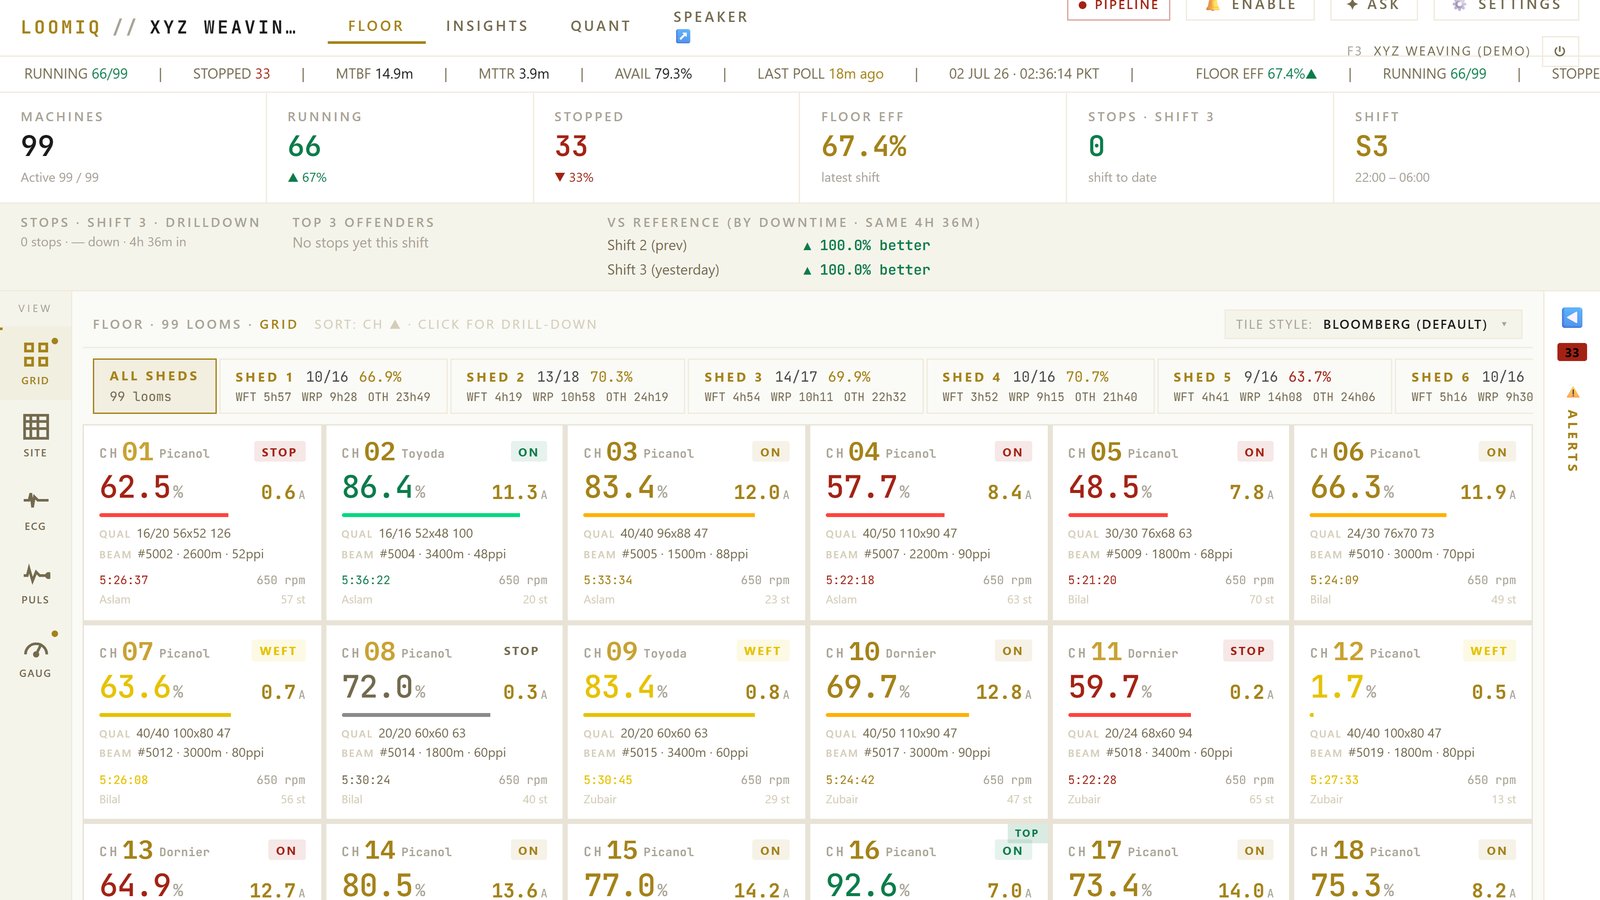
The live floor. 66 of 99 running, floor efficiency at a glance, every loom accounted for.

The answer sheet is ready before the meeting starts
LoomIQ 06:00 morning scorecard email with the day's flagged looms

Yesterday, already scored when you sit down

At 06:00 the day before arrives already scored: best foreman, bottom loom, top performers, and the handful of looms flagged for attention today. Every card reconciles with the full report standing behind it, so the morning meeting starts at the decision instead of the data pull. You choose exactly who receives it.

06:00daily scorecard
5looms flagged for today
1answer sheet, automatic
LoomIQ report families with date filters, CSV and one-click PDF export

Board-ready reports in one click

Six report families cover shift efficiency, loom-wise performance, single-loom history, loom sets, sheds, and quality. Each has date filters, exports to CSV, and prints to a letterheaded PDF for the board or the buyer. The report worth opening first is the downtime concentration grid, and on the demonstration floor it shows most downtime coming from stops under ten minutes, the opposite of where most mills point their maintenance.

6report families
433,957stops profiled, 30 days
1 clickto PDF or CSV
LoomIQ single-loom drill-down with efficiency trend and stop history

Beam changes with a week of warning

LoomIQ tracks every active beam and counts down to its change, so a beam swap is planned days ahead instead of discovered when the loom stops. The same detail view carries each loom's stop history, so maintenance walks up to a loom already knowing what it has been doing.

99active beams tracked
22due within 5 days
1 weekwarning on every change
Signal, not noise

A floor that swings by half a point a day will produce scary-looking dips forever. LoomIQ was built to tell a normal swing apart from a real change, and to score every quality on the same fair yardstick.

LoomIQ control bands and A-to-F loom grades separating normal variation from real change

Normal swing, or a real slip?

Control bands sit on the daily efficiency line and separate normal variation from a genuine change, so nobody wastes a morning chasing a dip that was always going to happen. Each loom carries an A-to-F grade that tells maintenance where to actually go. And quality is scored on one yardstick, stops per 100,000 picks, fair whether a loom runs a light or heavy construction, with a by-sizer view that answers whose beams break on the loom.

±0.6ptnormal daily swing
A to Fgrade per loom
100kpicks per stop yardstick

Ask the floor, in Urdu if you like

Ask LoomIQ a plain question about the floor and get a plain answer, in English or Urdu. A summary goes out automatically at 06:00 to the recipients you approve, so the people who need the picture get it without opening the app.

Honest from the first minute

Every stop is classified from the first minute of history, so the numbers are trustworthy from day one. Nothing is a black box. Every figure traces back to the raw telemetry it came from.

Fitted to your floor, not a template

LoomIQ is configured to how your mill actually runs, from the way you write a construction string to the shift clock your floor keeps.

Your qualities

Construction strings are parsed the way your mill writes them, not forced into someone else's format.

Your shift pattern

Two twelve-hour or three eight-hour shifts, your clock reflected everywhere the numbers appear.

Your looms

Airjet, shuttleless, or mixed fleets, any make. LoomIQ reads them all.

Your floor

Sheds, weaver sets, and foremen mapped as they stand, so the picture matches the walk.

Your reports

Columns and PDF layouts in the language your board reads.

Your deployment

Cloud hosted, or on-premise where policy requires. You choose.

What one screen holds
99looms on one live screen
<60sdata freshness
433,957stops profiled in 30 days
6board-ready report families
3languages, English and Urdu included
1source of truth for the floor

Figures shown are from a demonstration weaving floor. Your own numbers appear the day LoomIQ connects to your hardware.

LoomIQ on its own, or wired into your mill

Start with efficiency. Grow into the whole operation.

LoomIQ is the standalone efficiency and productivity layer, and for many mills that is the whole answer. When you want it connected to production tracking, dyeing batch control, inventory, and mill ERP, that is our wider textile software suite, where LoomIQ becomes the intelligence layer on top of the operational stack. Same team, same read-only respect for the floor, one step at a time.

See the textile suite
LoomIQ, answered plainly
What is LoomIQ?

LoomIQ is a loom monitoring and weaving-floor efficiency product from Sitara Infotech. It reads the data your looms already produce and turns it into one live picture of the whole floor: every loom as a tile with live status and efficiency, one-click drill-down to a single loom, a 3D site model, a 06:00 scored morning email, and board-ready reports. It is the standalone efficiency and productivity layer. If you also want it wired into production tracking, dyeing, and mill ERP, that is our textile software suite.

Do I need to replace my existing loom hardware or LDM system?

No. LoomIQ sits on top of the LDM hardware you already have, whether INZ, CLD, or a generic CT-sensor system. It reads the data, never writes to the vendor database, and never touches the sensors. Installation is read-only and plug-in-and-go. If LoomIQ goes down, the floor does not notice.

How fresh is the data?

The live floor refreshes within the minute. The moment a loom stops, you see it, rather than reading it off shift-end paper twelve hours later. Every stop is classified from the first minute of history so the numbers are honest from day one.

What does the morning email contain?

Yesterday, already scored, waiting at 06:00: best foreman, bottom loom, top performers, and the handful of looms flagged for attention today. Every card reconciles with the full report standing behind it, so the meeting starts at the decision instead of the data pull. You choose exactly who receives it.

What reports does LoomIQ produce?

Six report families cover shift efficiency, loom-wise performance, single-loom history, loom sets, sheds, and quality. Each has date filters, exports to CSV, and prints to a letterheaded PDF in one click for the board or the buyer. On the demonstration floor these families sit on top of 433,957 stops profiled over 30 days.

How does LoomIQ score efficiency fairly across different qualities?

It uses one yardstick, stops per 100,000 picks, which is fair whether a loom runs a light or heavy construction. A by-sizer view then answers the awkward question of whose beams break on the loom. Control bands separate a normal daily swing from a real change, and each loom carries an A-to-F grade so maintenance knows where to actually go.

Can the floor be queried in Urdu?

Yes. LoomIQ can summarise the floor and answer questions in English or Urdu, and send a plain-language summary automatically at 06:00 to the recipients you approve.

How do I try it on my own floor?

Book a 30-minute live demo. We walk your team through LoomIQ on a real weaving floor, make zero changes to any loom, and one visit is enough to connect to your existing hardware. Faisalabad first, the rest of Pakistan within hours, plus the UAE and the Gulf.

See your own floor in LoomIQ.
30 minutes · zero changes to any loom · we reply within 24 hours